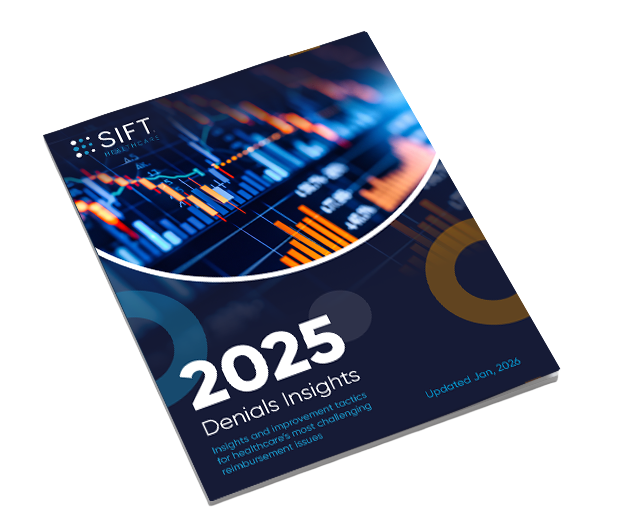
4th Annual Denial Insights Report
Payer Behavior Trends, Denial Patterns, Root Causes, and Actionable Intelligence
Healthcare organizations spent $19.7 billion contesting denied claims last year—yet denial rates persist at 15%.
Sift’s analysis of claims and payment data across diverse health systems reveals where revenue is leaking and what revenue cycle leaders can do about it.
Download the Full Report
Inside the Report
This unique and detailed report draws on Sift’s analysis of denial, downgrade, and payment data across health systems and hospitals of varying net patient revenue thresholds. We share the patterns we’ve identified and the strategies that work to better manage and prevent adverse payment outcomes.
What You’ll Learn:
- Which denial categories drive the largest revenue losses—and why
- How payer adjudication patterns differ by region, claim type, and DRG
- Clinical documentation gaps that consistently trigger adverse payment outcomes
- Appeal success rates by denial type and what drives overturn likelihood
- Role-specific recommendations for CDI, Coding, UR, and PFS teams
Who This Report Is For:
- CFOs and VP’s of Revenue Cycle who need to better quantify the impact of denials on their margins
- Revenue cycle executives benchmarking performance against peers
- PFS, CDI, and Coding directors seeking root cause insights
- UR managers tracking clinical validation and level-of-care trends
Want to See Your Own Data?
Industry benchmarks are useful, but nothing compares to analyzing your own denial patterns. Request a Denials Insights Report to see where your revenue is at risk—by payer, DRG, and service line.
Aligned to Outcomes, Not Promises
RevProtect is available through a performance-based engagement model designed to align incentives and reduce risk. Sift partners directly with health systems to tie success to measured reductions in denials and adverse payment outcomes (not activity, licenses, or usage).
Talk with us about whether a performance-based model makes sense for your organization.