
Your EHR denial reporting probably answers these questions well: How many accounts did each rep touch? Which queues are aging? What’s your denial rate by payer?
Those are legitimate operational questions. But they’re activity questions, and activity isn’t outcome. The gap between knowing what your team did and knowing whether it worked is where millions in recoverable reimbursement revenue disappears. We’ve started describing this gap using a five-level reporting maturity model, because it helps explain what’s actually missing, and what you need to close it.
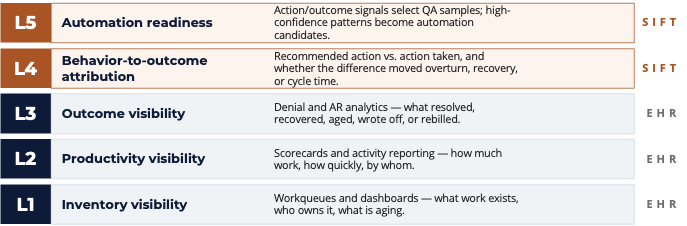
The 5 levels of denial reporting
Level 1 — Inventory visibility
Workqueues, dashboards, aging reports. What work exists, who owns it, what’s been waiting too long. EHR-native tools do this.
Level 2 — Productivity visibility
Scorecards and activity reporting. How much work, how quickly, by whom. EHR-native tools do this too, and most teams are measuring here.
Level 3 — Outcome visibility
Denial and AR analytics. What resolved, recovered, wrote off, aged past recovery, or got rebilled. Most mature EHR implementations reach Level 3. This is where denial rate by payer lives, along with overturn rates and gross recovery.
Level 4 — Behavior-to-outcome attribution
This is where EHR-native reporting runs out. Level 4 asks 1) When a recommended action was taken versus when it wasn’t, did it make a measurable difference? 2) Did working a specific denial type with a specific evidence set actually improve overturn rate, or did the rep just touch the account and move on? Answering these requires connecting what was recommended, what was done, and what resulted, at the account level, across your full payer and denial mix.
Level 5 — Coaching and automation readiness
When you have Level 4 data, you can identify which action-outcome patterns are strong enough to automate, and which are variable enough to require human judgment. You can also use outcome signals to select QA samples, so your quality review is drawn from accounts where behavior and outcome diverged, not from a random sample that tells you nothing operational.
Levels 4 and 5 require data sources and closed-loop tracking that don’t exist in EHR architecture. They require connecting 835 adjudication outcomes back to the specific action taken, on the specific account, within the specific recommendation window.
Why stopping at Level 3 is a revenue problem, not just a visibility problem
When you’re measuring at Level 3, you can see that your overturn rate on Payer X is 54%. What you can’t see is that when your team follows the recommended action within the appeal window, overturn is 73%. When they don’t, it drops to 41%. That 32-percentage-point gap is the actual cost of your workflow adherence problem, and it’s invisible from a denial rate dashboard.
There’s a related problem with attributing recovery dollars. Most health systems credit recovered revenue to everyone who touched an account. When an account goes through three queue owners and eventually overturns, all three get credit. A behavior-to-outcome model credits only the actions that actually moved the claim, meaning your attribution is grounded in what worked, not just what happened.
Revenue cycle teams running Level 3 analytics can tell you denial rate went down. Teams running Level 4 can tell you why, and which specific behavior change drove it.
What closed-loop data looks like in practice
This isn’t theoretical. One way to see it clearly is through a built-in counterfactual, comparing accounts that were worked at a given priority tier against accounts that weren’t, holding payer mix, denial type, and engine score constant. The only variable is whether the work happened.
In one health system that Sift worked with, that comparison showed a 62% overturn rate on worked accounts versus 43% on unworked accounts at the same priority tier. The 19-point gap is a signal about what the current prioritization model is leaving on the table, and which accounts should be touched first.
The other number worth watching is recommendation adherence, the percentage of recommended actions actually followed within the appeal window. When that figure sits at 58%, it doesn’t mean your team is performing poorly. It usually means the workflow or the timing is creating friction. But you can’t identify that or fix it without the data.
What to look for in your own denial reporting
If you’re auditing where your denial analytics actually sit, here are the questions that clarify it:
- Can you see which action was taken on a denied account, not just whether it was touched?
- Can you compare overturn rates when a specific recommendation was followed versus not followed?
- Can you see the dollar recovery attributable only to accounts where the full recommended workflow was completed, not just every account that touched your queue?
- Can you identify which staff members are under-performing when adjusted for account complexity, meaning you’re not comparing a rep who handles easy commercial denials against one handling complex Medicare Advantage medical necessity cases?
If the answer to most of these is no, you’re working from Level 3 data. This is where most teams are. In this level, there’s a ceiling on how precisely you can improve.
Sift’s RevProtect Payments Intelligence Platform adds Levels 4 and 5 to your existing EHR reporting. RevProtect connects recommended action, actual behavior, and adjudication outcome at the account level across your full payer mix. If you want to see what that looks like in your data, request a Denials Insights Report today.