
Most denial workqueues direct users to work accounts from oldest or largest first, assuming that recovery will follow. It seems like a reasonable assumption, but it’s wrong in a way that costs health systems real revenue (and wastes valuable time/touches). Prioritizing denials in this way doesn’t surface the account most likely to be overturned.
The shape of a denied A/R population is not flat. Value is sharply concentrated in a small percentage of accounts. Legacy prioritization logic (static rules) can’t see that concentration. ML-driven scoring can, and the difference in recovery outcomes between the two approaches is significant.
What the Denials Distribution Actually Looks Like
When Sift scores a denied A/R population using ML-driven prioritization, we consistently see the same pattern. A small fraction of accounts, typically the top 15–20% by Sift’s score, holds the majority of recoverable value. The bottom half of the population, by contrast, produces a fraction of actual recovery dollars regardless of how much time is spent working it. Sometimes these accounts will take several touches, and the total dollars recovered will be $5-$20.
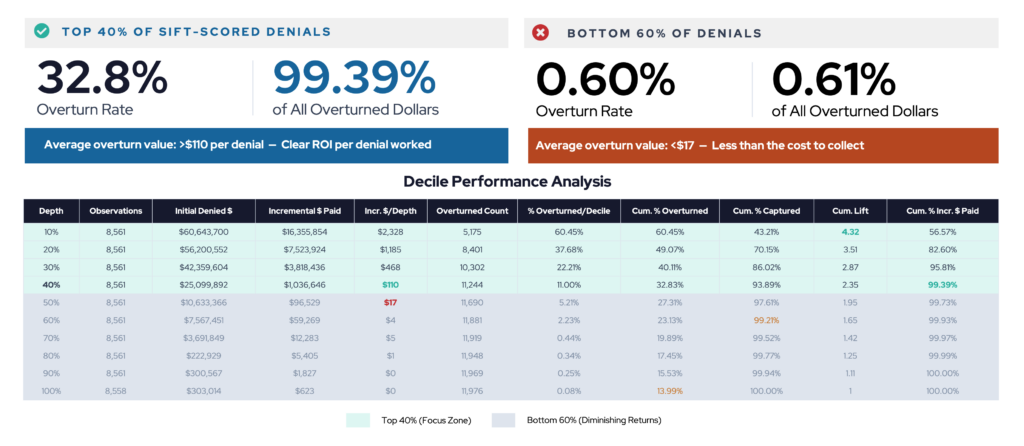
At Hartford HealthCare, which deployed Sift’s RevProtect ML-driven scoring across more than 150,000 denied claims in a single fiscal year. Roughly 75% of incremental overturn recovery dollars came from accounts in the top 16% of RevProtect scores. The bottom ~49% of scored accounts, nearly half the denial population, accounted for just 4.1% of recovered dollars.
Why Legacy and EHR-Native Denials Tools Can’t See This
Standard denial workqueue logic prioritizes by account age, payer, dollar balance, or some combination of the three. These might be reasonable proxies, but they’re not accurate predictors of which specific accounts will actually be overturned.
A $40,000 denial from a commercial payer at 95 days looks identical to another $40,000 denial from the same payer at the same age under rules-based logic. But one may have a 78% propensity to overturn based on claim attributes, payer behavior history, DRG, and service line. The other may have an 11% chance. Working them the same way means one of those accounts gets the attention it deserves and one doesn’t, but you won’t know which until the work is done and the result is in.
Multiply that across tens of thousands of denied accounts, and the cost of imprecise prioritization becomes a structural problem, not a workflow inefficiency.
What Changes When Prioritizing Denials Is ML-Driven
The practical shift is that staff effort gets concentrated where recovery is actually probable, rather than distributed evenly across a worklist.
At one health system, following a disruption to their clearinghouse that forced a reset of denial follow-up strategy, the team leaned heavily into ML-driven scoring to rebuild their prioritization approach. In the final four months of their fiscal year, compared to the first four, denial overturn recovery rate improved 54%. The scoring didn’t change the claims; it changed which claims the team worked first.
At ProHealth Care, a Wisconsin-based health system, the same approach delivered a 5:1 ROI in year one. Their overturn dollar rate improved 39.4% in the first month after go-live alone.
The Outsourcing Problem
This matters even more when denial follow-up is outsourced. When vendors are working your denied A/R without ML-driven prioritization guidance, they’re making their own triage decisions, typically the same rules-based logic your internal team uses. You lose visibility into which accounts are being worked, in what order, and whether that order reflects actual recovery probability.
ML scoring changes the vendor relationship. When accounts are scored before they go to a vendor, you can direct follow-up by score tier, measure vendor performance against recovery rate on high-score accounts specifically, and identify quickly when low-score accounts are consuming disproportionate effort. The score becomes a management tool, not just a workflow tool.
Prioritizing Denials With Intelligence
If your current prioritization logic can’t tell you which 20% of your denied accounts hold the majority of your recoverable value, the workqueue your team is working today is built on assumption rather than evidence. That assumption has a dollar cost, it’s just not visible until you can see the distribution.
If you want to see how value is distributed across your specific denial population, that’s an analysis Sift can run against your data.